A beautiful baby portrait
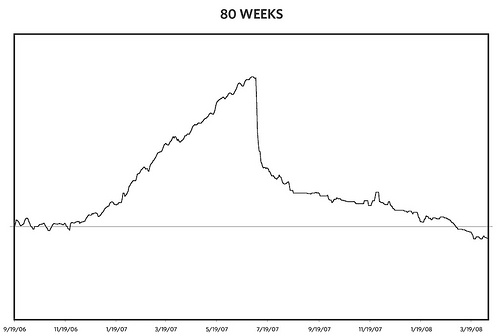
My wife is a bit of a statistics nut. A few years ago, she hooked herself up to a heart rate monitor during a playoff football game and graphed the results. Sometimes I think she does things just so she’s got an excuse to open up Excel. So I wasn’t really surprised when she showed me this graph yesterday afternoon:

That’s a record of Meg’s weight from when she got pregnant with Ollie to the present, 80 weeks of data in all…40 weeks with Ollie on the inside and 40 on the outside.
Charles Joseph Minard may get all the accolades for his graphic of Napolean’s march to Moscow, but for me, the above chart is the most beautiful ever created. When I look at it, I see Ollie. The graph is a portrait of him, as sure as this photo is. It’s also a record of an intense time for our family. I’m reminded of Meg, happy and pregnant but also struggling with her changing body. Trips we took, doctor visits, the growing belly and anticipation, the birth itself, and then falling off the cliff into the giddy, difficult unknown of new parenthood. And then you can see Meg slowly but surely getting back into shape while being a full-time stay-at-home mom (and managing an architecture project to boot), and achieving her goal of getting back to her pre-baby fitness level in a scant 8 months. You can’t really see it, but there’s a happy father and proud husband in there somewhere as well.
That’s a lot of emotional impact for a simple black and white line graph with few labels. Imagine if it were in color and isometric 3-D! ;)


Stay Connected