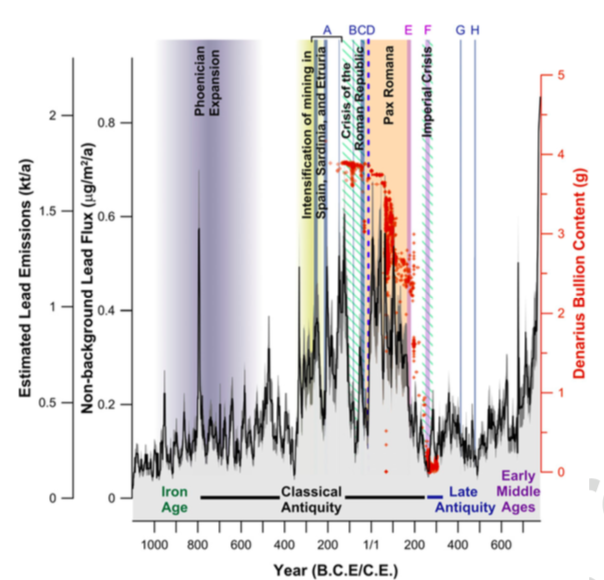
A year-by-year history of economic growth and pollution in the Roman Empire

A new study published in Proceedings of the National Academy of Sciences analyzes deep ice cores in Greenland for traces of lead pollution in antiquity. This pollution, the scholars claim, matches the production of Roman silver coins from impure alloys from mines in what’s now modern Spain. In short, we can see Roman monetary production, and by proxy, peaks and valleys in the economy throughout the Roman world, on an extremely granular basis, captured year-by-year in arctic ice.
In 218 B.C., for instance, when Rome fought with Carthage in the Second Punic War, lead pollution appears to fall—and then it rises, abruptly, as Roman soldiers seized Carthaginian mines in southern Spain and put them to use. It also detects nonviolent events: When Rome debased its currency, reducing the amount of silver in each denarius coin in 64 A.D., lead pollution in the air fell…. When compared with other studies, research suggests that Western Europe may have seen higher lead emissions during the Pax Romana than at any time prior to the Industrial Revolution, nearly 1,800 years later.
Which is, of course, part of the lesson: one argument holds that lead pollution, both in the air, in water pipes, and other uses throughout Rome, eventually slowly poisoned and destroyed the Roman Empire, along with plagues, imperial overreach, and political dysfunction. Our civilization, however, is at least documenting its own destruction in the written record in much greater detail.


Stay Connected